Over the past year, the word “motor vehicle recall” and “Toyota” seemed to have some strong correlation, including the headline news last week. They sure screwed up with corporate response for that incident, but that by no means suggest that Toyota is the only manufacturer that makes bad cars. “Good” cars get recalled all the time, but the current public perception combines both Toyota’s market share and the evil media’s tendency to continuously trashing a reputation. You know, like the five thousand stories written about BP this summer.
The fact is, even if 100% of Porsche cars are defective, they won’t recall as many as Toyota did this year. So the question intrigued me: which manufacturer makes the most reliable cars, measured by the least proportion recalled? I did some homework, combining a comprehensive recall history database from the Department of Transportation, and a car market share report from Motor Intelligence (which is the basis of this WSJ report). The results for 2001-2010 recalls are:

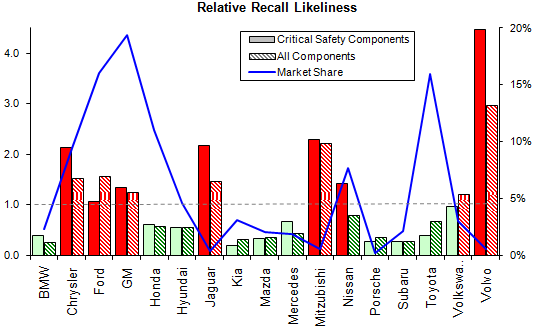
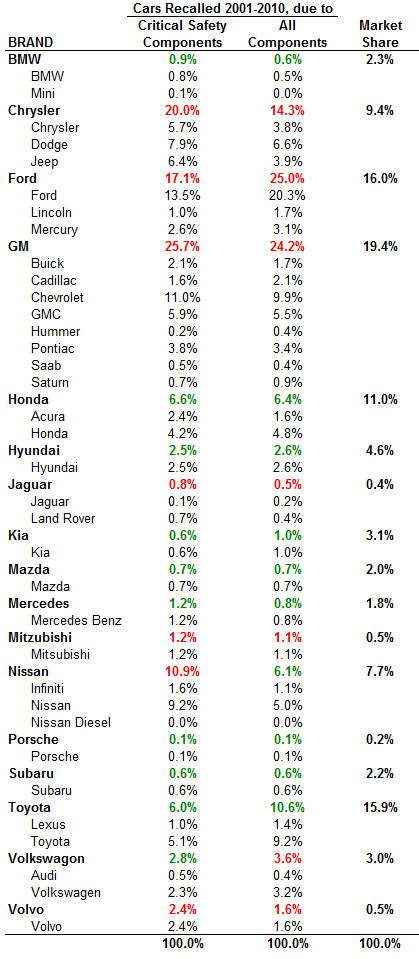
It works like this: Toyota has a 15.9% market share (combining cars and light trucks), and among all cars recalled in the past 10 years for defective critical safety components, Toyota only makes up 6.0%. Therefore, they get a score of 6.0/15.9=0.38. That is, if you drive a Toyota, the chances of it being bad is barely more than 1/3 of the chances for the average car on the road. On the other hand, Chrysler has 9.4% market share but 20.0% of all critical recalls, so they get a score of 2.13 meaning it’s twice as likely to be bad as the average car.
The chart above shows two bars for each major manufacturer, with the solid bar indicating recalls of critical safety components (engine, brakes, power train, tires) and the striped bar indicating all components (from traction control systems and seat belts to seats and hitches). Nissan/Infiniti, for example, have less than average total recalls but more than average critical recalls. Volkswagon/Audi is the opposite.
Volvo, for some reason, is 4.5 times as likely to be recalled as everybody else. But they deserve the benefit of doubt since given the tiny market share, their data is more prong to high volatility. It’s important to keep in mind the credibility of each data point and assess the conclusion carefully. The market share is graphed in blue, with GM at 19.4% and Toyota at 15.9%. A more detailed table is at the bottom of this post.
Conclusions? Although scare-driven bad publicity about Toyota is all over the news these days, hard data indicate that they are still one of the most reliable manufacturers out there. Kia is better, and the big three from Detroit are still sucky.
